Contigency Table Analysis / Chi-Square
Contingency table analysis is a common method for analyzing the association between two categorical variables. Consider a categorical variable that has r possible response categories and another categorical variable with c possible categories. In this case, there are r × c possible combinations of responses for these two variables. The r × c crosstabulation or contingency table has r rows and c columns consisting of r × c cells containing the observed counts (frequencies) for each of the r × c combinations. This type of analysis is called a contingency table analysis which uses a chi-square statistic to compare the observed counts with those that would be expected if there were no association between the two variables.
Appropriate Applications of Contingency Table Analysis / Chi-Square
Design Considerations for Contingency Analysis / Chi-Square
Two Sampling Strategies
Two separate sampling strategies lead to the chi-square contingency table analysisdiscussed here.
1. Test of independence. A single random sample of observations is selected from the population of interest, and the data are categorized on the basis of the two variables of interest. For example, in the marketing research example above, this sampling strategy would indicate that a single random sample of companies is selected, and each selected company is categorized by size (small, medium, or large) and whether that company returned the survey.
2. Test for homogeneity. Separate random samples are taken from each of two or more populations to determine whether the responses related to a single categorical variable are consistent across populations. In the marketing research example above, this sampling strategy would consider there to be three populations of companies (based on size), and you would select a sample from each of these populations. You then test to determine whether the response rates differ among the three company types.
Hypotheses for a Contingency Table Analysis / Chi-Square
The statement of the hypotheses depends on whether you used a test of independence or a test for homogeneity.
Test of Independence
In this case, you have two variables and are interested in testing whether there is an association between the two variables. Specifically, the hypotheses to be tested are the following:
H0: There is no association between the two variables.
Ha: The two variables are associated.
Test for Homogeneity
In this setting, you have a categorical variable collected separately from two or more populations. The hypotheses are as follows:
H0: The distribution of the categorical variable is the same across the populations.
Ha: The distribution of the categorical variable differs across the populations.
Hypothetical Example
Click Here To Download Sample Dataset (SPSS Format)
Research Scenario and Hypothesis
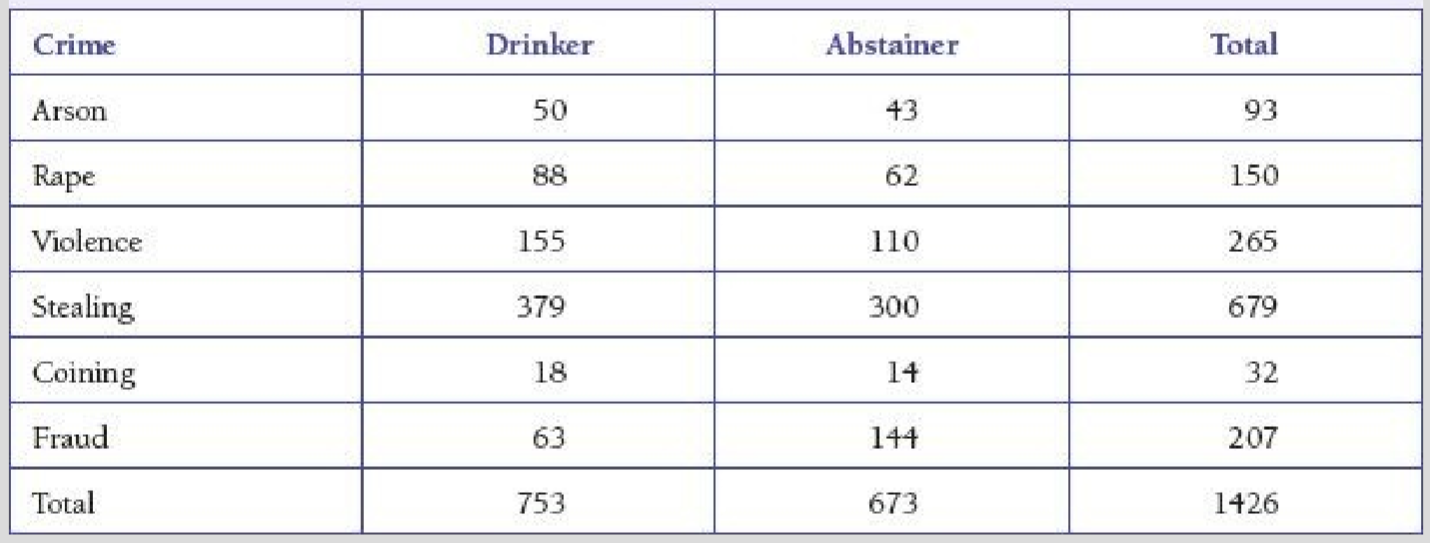
In 1909, Karl Pearson conducted a now classic study involving the relationship between criminal behavior and the drinking of alcoholic beverages. He studied 1,426 criminals, and the data in Table following table show the drinking patterns in various crime categories. (The term coining in the table is a term for counterfeiting that is no longer in common usage.) This table is made up of counts in 6 x 2 = 12 cells, and, for example, 300 subjects studied were abstainers who had been convicted of stealing.
The hypotheses of interest are as follows:
H0: There is no association between type of crime and drinking status.
Ha: There is an association between type of crime and drinking status.
Sample Output
Interpretation:
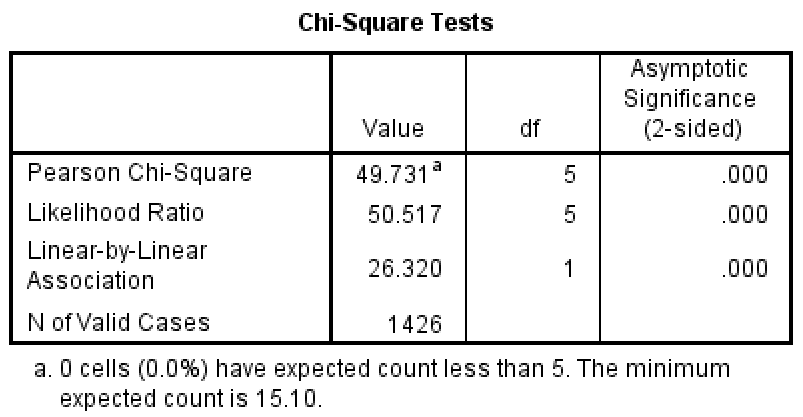
In Table present here, we show the statistical results related to the analysis of these data. The value of the chi-square statistic is 49.731, with 5 degrees of freedom and p = 0.000 (this would be reported as p < 0.05), and thus we reject the null hypothesis of no association and conclude that there is a relationship between crime and drinking status. As previously mentioned, this relationship is primarily due to the unusual fact that about 70% of the criminals convicted of fraud were abstainers. (One wonders if there was some “fraud” involved in these criminals’ answers to this question.) It can also be seen that the expected frequencies are relatively close to the observed frequencies for each cell except in the cells for fraud.
Continue to Index